CrowdSec Web UI: The Dashboard CrowdSec Should Have Shipped With
When I first deployed CrowdSec, I had the same experience many self-hosters do. The logs showed some activity, the bouncer was blocking IPs! cscli metrics looked healthy. But I still found myself asking:
Is CrowdSec actually doing anything?

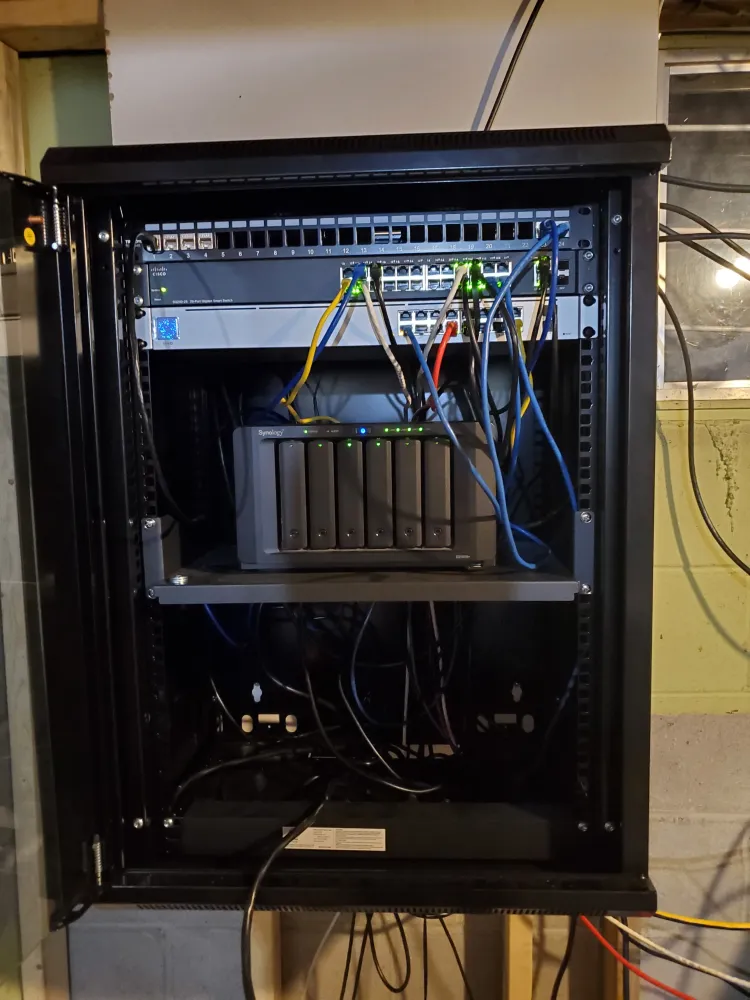
There is a specific kind of satisfaction that comes from watching your local logs go quiet because your firewall is doing its job. But in the Scrap Lab, "quiet" can sometimes feel like "empty."
But then, I decided to flip the switch on the CAPI (Central API) feed.
Sure, I could dig through command-line output and query the Local API directly, but neither gave me a quick, visual overview of what was happening across my environment.
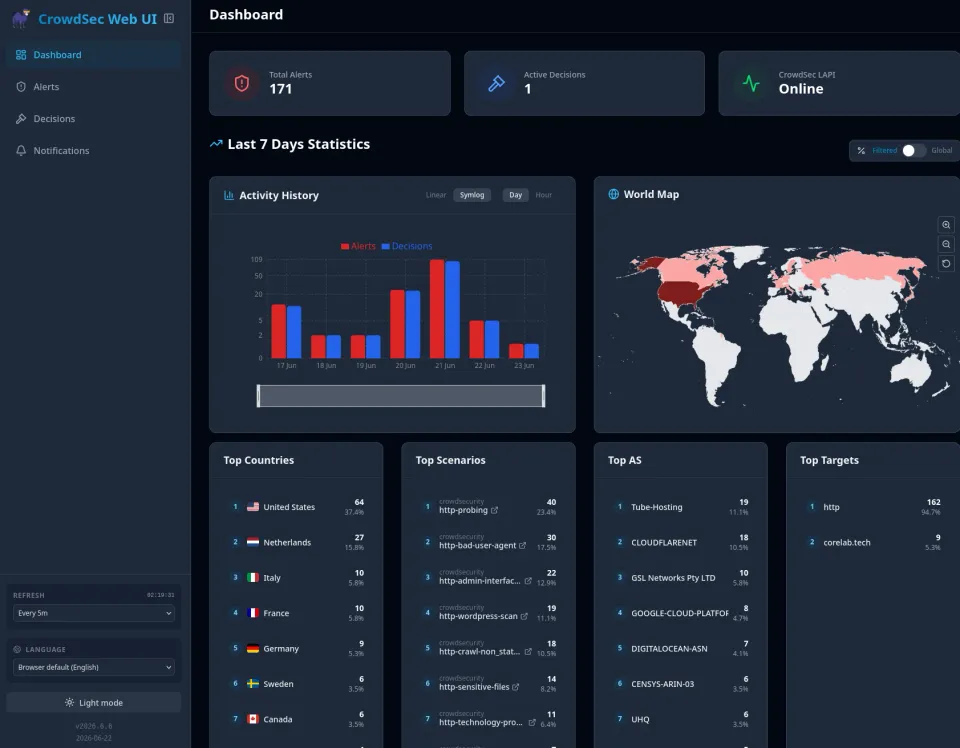
That's where CrowdSec Web UI comes in.
📋 TL;DR Summary: CrowdSec Web UI for Observability
Built by TheDuffman85, CrowdSec Web UI is a lightweight, self-hosted dashboard that connects directly to your CrowdSec Local API (LAPI) and turns raw security events into something you can actually understand at a literal glance.
This is part of the my Homelab Observability Series:
Homelab Observability
Logging & Threat Maps
Part 1: Building a Homelab Mini-SIEM with Grafana, Loki & Promtail
Network Visualization
Part 2: Mapping Your Network Topology with Homelable
Security Auditing
Part 3: Auditing the Castle - Scan & Pen-Test Your Homelab
Active Defense Forensics
Part 4: Verifying CrowdSec - Logs, Alerts & CLI Blasting
It will be made public on Tues July 7th 2026!