
Building a Homelab Mini-SIEM with Grafana, Loki, and Promtail
🛡️A battle-tested roadmap to turning noisy logs into actionable threat intelligence.
If you run an OPNsense firewall and a Docker-based reverse proxy like SWAG (NGINX), you already have powerhouse tools. But their logs are often siloed and overwhelming. Without a central "brain," answering simple questions like "Who is attacking my port 443 right now?" requires tedious SSH sessions and manual grepping.
This guide focuses on building a Mini-SIEM (Security Information and Event Management) system using the GLP Stack: Grafana (Visualization), Loki (Storage), and Promtail (Shipping).
Why a Mini-SIEM?
- OPNsense: Move beyond the "Live View" to see historical trends (e.g., Top 10 blocked IPs this week).
- NGINX: Identify botnets scanning for sensitive files like
.envorwp-login.php. - Active Defense: Visualize Fail2Ban or CrowdSec events to see who your "Active Defense" is catching in real-time.
Sounds overkill for a homelab or self-hosted environment, but it's not if you host even a single publicly exposed service.
📋 TL;DR Summary: The GLP Stack for SIEM
A Homelab Mini-SIEM (Security Information and Event Management) is a centralized logging system that uses Grafana for visualization, Loki for log storage, and Promtail for log ingestion. By connecting OPNsense firewall logs and NGINX reverse proxy data, you can create real-time global threat maps, "Top Attacker" leaderboards, and instant security alerts via Discord or Email.
🛠️ Prerequisites
- A server running Docker Compose.
- An OPNsense firewall (or any firewall supporting RFC 5424 syslog).
- A SWAG or NGINX container with access logs enabled.
- MaxMind GeoLite2-City.mmdb: Required for the world map visualization. Get it here or from Github as well.
- This guide is utilizing the Github hosted one (I downloaded it) and it only goes to the country level.
- Pay attention to which mmdb you use: to use the GeoLite2-Country.mmdb instead, you must update the
db_type: citytodb_type: countryin the config, and the other way around as well, or it will throw an error.
- Pay attention to which mmdb you use: to use the GeoLite2-Country.mmdb instead, you must update the
- This guide is utilizing the Github hosted one (I downloaded it) and it only goes to the country level.
1. Can use any storage path you want, doesn't have to be /opt/DOCKERS. Just make sure you pick & create the folders 😉
2. Ensure to set permissions and users properly. If you're a little lost, it would be good to read the docker compose guide linked in the pre-reqs above.
The image is configured to run by default as user
loki with UID 10001 and GID 10001. You can use a different user, specially if you are using bind mounts, by specifying the UID with a docker run command and using --user=UID with a numeric UID suited to your needs.Installation Startup
Step 1: Storage - First, make a project folder or make the folders you will store this in simply by typing mkdir loki or mkdir minisiem or whatever folder name is meaningful to you. For the purposes of this guide, I'll use the folders loki, grafana or promtail as I reference them. I chose to keep them in a separate folder each, but you can also store them into one folder together. Your structure if you follow this guide will look like /opt/DOCKERS/grafana, loki, promtail separately.
Creating the folder skeleton/structure:
#1. Create the directory skeleton
sudo mkdir -p /opt/dockers/{loki,promtail,grafana}
Step 2: Permissions - As mentioned above, it runs as a specific user already but with bind mounts, you may need to set ownership on the new folders:
# 1. Set Ownership (CRITICAL)
sudo chown -R youruser:yourgroup /opt/dockers/loki
sudo chown -R youruser:yourgroup /opt/dockers/promtail
sudo chown -R youruser:yourgroup /opt/dockers/grafana

sudo chmod -R youruser:yourgroup /opt/dockers/loki
sudo chmod -R youruser:yourgroup /opt/dockers/promtail
sudo chmod -R youruser:yourgroup /opt/dockers/grafana
Docker Compose stack config:
services:
  loki:
    image: grafana/loki:latest
    container_name: loki
    ports:
      - "3100:3100"
    command: -config.file=/etc/loki/local-config.yaml
    volumes:
      - /opt/DOCKERS/loki/config.yaml:/etc/loki/local-config.yaml
      - /opt/DOCKERS/loki/data:/tmp/loki
    restart: unless-stopped

  promtail:
    image: grafana/promtail:latest
    container_name: promtail
    volumes:
      - /var/log:/var/log
      - /opt/DOCKERS/promtail/config.yaml:/etc/promtail/config.yaml
      # This allows Promtail to see all your other Docker container logs
      - /var/lib/docker/containers:/var/lib/docker/containers:ro
    command: -config.file=/etc/promtail/config.yaml
    restart: unless-stopped

  grafana:
    image: grafana/grafana:latest
    container_name: grafana
    ports:
      - "3000:3000"
    environment:
      - GF_SECURITY_ADMIN_USER=admin
      - GF_SECURITY_ADMIN_PASSWORD=admin
      - GF_USERS_ALLOW_SIGN_UP=false
    volumes:
      - /opt/DOCKERS/grafana/data:/var/lib/grafana
    restart: unless-stopped

networks:
  siem-network:
    driver: bridge
Continue below before starting the stack!
🏗️Part 1: Loki Tuning (The Foundation)
The Trap: If you launch Loki with default settings, it will eventually fill your hard drive or reject logs with "429 Too Many Requests." We need a production-ready configuration.
1. Create the Configuration
Create local-config.yaml in your Loki config directory. This setup includes a Compactor to manage disk space and a 14-day retention policy. (e.g., /docker/loki/config). Here it is:
auth_enabled: false

server:
  http_listen_port: 3100

common:
  path_prefix: /loki
  storage:
    filesystem:
      chunks_directory: /loki/chunks
      rules_directory: /loki/rules
  replication_factor: 1
  ring:
    kvstore:
      store: inmemory

schema_config:
  configs:
    - from: 2020-10-24
      store: tsdb
      object_store: filesystem
      schema: v13
      index:
        prefix: index_
        period: 24h

# --- THE GARBAGE COLLECTOR (Retention) ---
# Critical to prevent disk full errors
compactor:
  working_directory: /loki/boltdb-shipper-compactor
  delete_request_store: filesystem
  compaction_interval: 10m
  retention_enabled: true
  retention_delete_delay: 2h
  retention_delete_worker_count: 150

# --- LIMITS & TUNING ---
limits_config:
  # Allow bigger log lines
  max_line_size: 1MB
  max_line_size_truncate: true

  # Allow faster ingestion bursts (Prevent 429 errors)
  ingestion_rate_mb: 20
  ingestion_burst_size_mb: 40

  # Allow old logs during initial setup
  reject_old_samples: false
  reject_old_samples_max_age: 168h

  # Global Retention: Delete logs older than 14 days
  retention_period: 336h

  # Allow "Top Attackers" tables to scan more data
  max_query_series: 2000
Pro Tip: Ensure your docker-compose.yml mounts this file to /etc/loki/local-config.yaml. If you used my compose stack above, it does already.
📡Part 2: Promtail & OPNsense Configs
OPNsense sends logs via Syslog. We need Promtail to catch them. This is pretty easy to configure in OPNsense as it's just sending a copy of the logs to our Promtail instance.
1. Promtail Config (config.yaml)
server:
  http_listen_port: 9080
  grpc_listen_port: 0

positions:
  filename: /tmp/positions.yaml

clients:
  # UPDATE THIS IP to match the Loki IP if you changed it!
  - url: http://your_loki_ip:3100/loki/api/v1/push

scrape_configs:
  - job_name: syslog
    syslog:
      listen_address: 0.0.0.0:1514   # Listen on TCP 1514
      listen_protocol: tcp
      label_structured_data: true
    relabel_configs:
      - source_labels: ['__syslog_message_hostname']
        target_label: 'host'
2. OPNsense Configuration
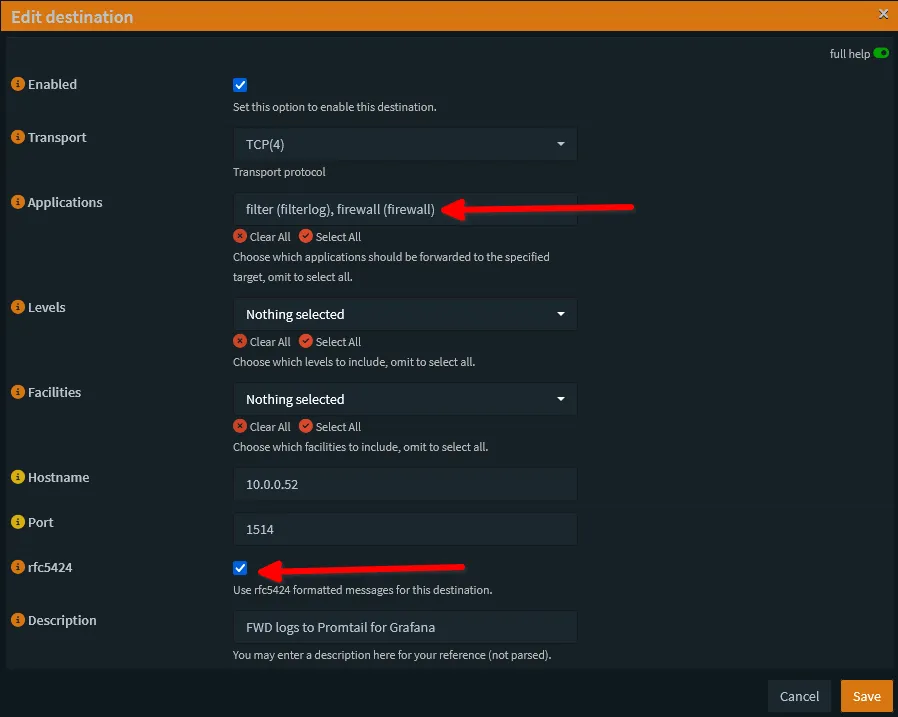
Navigate to System > Settings > Logging / Targets and create a new target:
- Transport: TCP (Recommended for reliability).
- IP Address: Your Docker host IP.
- Port: 1514.
- Format: Syslog (RFC 5424). Crucial: Default syslog will break your parsing regex.
Here's how this looks in my OPNsense:
Start the Stack!✅
Now that you have these configs all sorted (a config for loki & promtail), docker compose up -d and watch the stack come to life via docker logs -f loki or promtail or grafana for live logs!
🛠️ Connecting to Grafana
- Log in to Grafana http://servereip:3000.
- Go to Connections > Data Sources.
- Add Loki.
- For the URL, use: http://serverip:3100.
- Hit Save & Test.
I kept the next part after you fire up the stack because you'll need to do the final config in the grafana webgui. It becomes a lot of trail and error to tweak your dashboard the way you like!
🌍Part 3: NGINX & GeoIP (Mapping the Threats)
For Docker containers, we don't need syslog. We can just "bind mount" the logs directly. This is very performant and production best practice where possible. In Enterprise deployments, often docker logs will stream to a central location for ease of access.
1. Mount the Logs & GeoIP DB
Update your docker-compose.yml for the Promtail service:
  promtail:
    volumes:
      # Map the logs from your host
      - /path/to/swag/log:/var/log/swag:ro
      # Map the GeoIP database
      - /path/to/geoip:/etc/promtail/geoip
2. The GeoIP Pipeline (promtail/config.yaml)
This pipeline does three things: finds the IP, looks up the Country, and adds it as a label (geoip_country_name). You can go further and if you download the more detailed mmdb, you can go right to the city and even neighborhood level! You add this below👇 the config above☝️.
  - job_name: nginx
    static_configs:
      - targets:
          - localhost
        labels:
          job: nginx
          host: swag
          __path__: /var/log/swag/nginx/*.log

    # --- PIPELINE START ---
    pipeline_stages:
      # 1. Regex: Extract the IP from the log line
      - regex:
          expression: '^(?P<client_ip>[\d\.]+) -.*'
      # 2. GeoIP: Lookup the IP in the database
      - geoip:
          db: /etc/promtail/geoip/GeoLite2-City.mmdb
          source: client_ip
          db_type: city
      # 3. Label: Add the Country Name (e.g. "Canada")
      - labels:
          geoip_country_name:
Complete promtail config should look something like this:
server:
  http_listen_port: 9080
  grpc_listen_port: 0

positions:
  filename: /tmp/positions.yaml

clients:
  # UPDATE THIS IP to match the Loki Static IP you chose above
  - url: http://your_loki_ip:3100/loki/api/v1/push

scrape_configs:
  - job_name: syslog
    syslog:
      # Listen on all interfaces inside the container
      listen_address: 0.0.0.0:1514
      labels:
        job: "opnsense"
    relabel_configs:
      - source_labels: ['__syslog_message_hostname']
        target_label: 'host'

  - job_name: docker
    docker_sd_configs:
      - host: unix:///var/run/docker.sock
        refresh_interval: 5s
    relabel_configs:
      - source_labels: ['__meta_docker_container_name']
        regex: '/(.*)'
        target_label: 'container'

# 1. NGINX Access & Error Logs
  - job_name: nginx
    static_configs:
      - targets:
          - localhost
        labels:
          job: nginx
          host: swag
          # Wildcard catches access.log AND error.log
          __path__: /var/log/swag/nginx/*.log

# --- NEW: Pipeline to add Country Codes ---
    pipeline_stages:
      # 1. Parse the NGINX log to extract the IP
      # (We use the same pattern as Grafana, but translated for Promtail)
      - regex:
          expression: '^(?P<client_ip>[\d\.]+) -.*'

      # 2. Look up the IP in the database
      - geoip:
          db: /etc/promtail/geoip/GeoLite2-City.mmdb
          source: client_ip
          db_type: city

      # 3. Add the Country Code as a permanent label
      - labels:
          geoip_country_name:
Pro Tip: If your NGINX / SWAG / Reverse proxy is on a different host or somewhere else, your config will be a bit different.
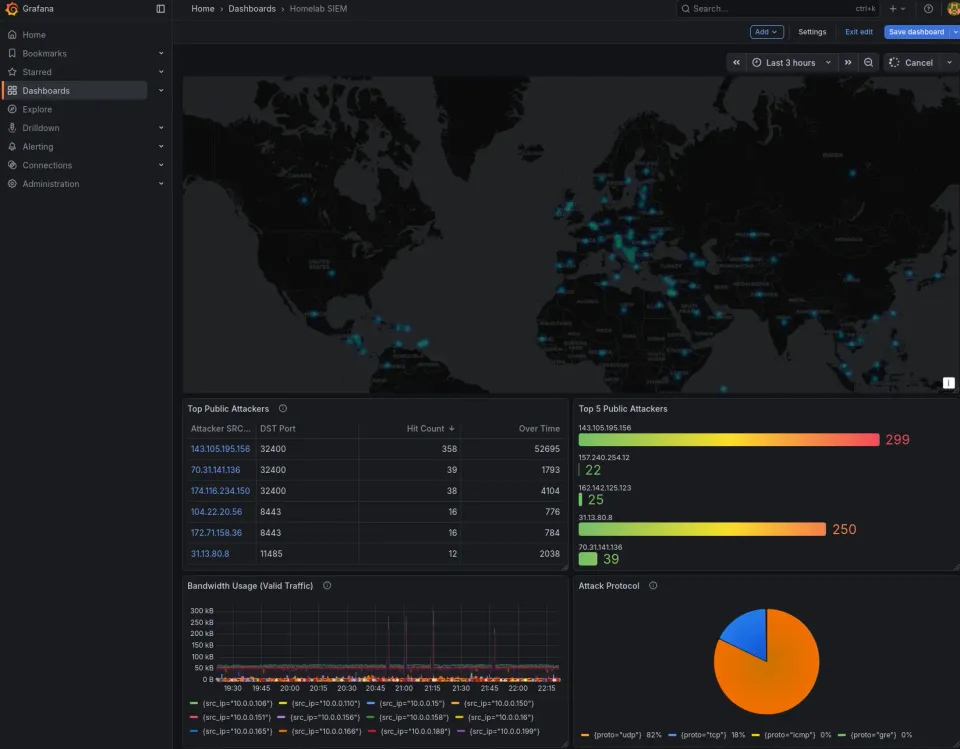
📊Part 4: The Dashboards (Golden Queries)
Create a new Dashboard in Grafana. Pay close attention to the Visualization Settings - specifically "Query Type" and "Map Layers." These are all called LogQL queries.
Row 1: OPNsense Firewall
Panel 1: Top Public Attackers (Table)
Viz: Table | Query Type: Instant
sum by (src_ip, dst_port) (
  count_over_time(
    {host="OPNsense.altius.home"}
    |= "block"    # <--- Performance Trick: Filter before Regex
    | regexp `(?P<action>pass|block|reject|nat|rdr),.*?,(?P<proto>tcp|udp|icmp|igmp|esp|gre),.*?,(?P<src_ip>\d{1,3}(?:\.\d{1,3}){3}),(?P<dst_ip>\d{1,3}(?:\.\d{1,3}){3})(?:,(?P<src_port>\d+),(?P<dst_port>\d+))?`
    | action="block"
    | src_ip != ip("10.0.0.0/8")       # Filter LAN
    | src_ip != ip("192.168.0.0/16")
    | label_format dst_port=`{{ if .dst_port }}{{ .dst_port }}{{ else }}0{{ end }}`
    [$__range]    # <--- Uses the dashboard time picker
  )
)
Panel 2: Top 5 Attackers (Bar Gauge)
This is the "Leaderboard" chart.
- Viz: Bar Gauge | Query Type: Instant
- CRITICAL SETTINGS (Right Sidebar):
- Value options > Show: Set to "All values". (If you leave this on "Calculate", you get one giant blob instead of 5 bars).
- Transformations: Ensure this tab is EMPTY. Delete any "Reduce" or "Limit" transformations.
- Orientation: Horizontal.
topk(5, sum by (src_ip) (
  count_over_time(
    {host="OPNsense.altius.home"}
    |= "block"
    | regexp `(?P<action>pass|block|reject|nat|rdr),.*?,(?P<proto>tcp|udp|icmp|igmp|esp|gre),.*?,(?P<src_ip>\d{1,3}(?:\.\d{1,3}){3}),(?P<dst_ip>\d{1,3}(?:\.\d{1,3}){3})(?:,(?P<src_port>\d+),(?P<dst_port>\d+))?`
    | action="block"
    | src_ip != ip("10.0.0.0/8")
    | src_ip != ip("192.168.0.0/16")
    [$__range]
  )
))

Row 2: Web Traffic (SWAG)
Panel 3: Global Threat Map
- Viz: Geomap | Location Mode: Lookup | Lookup Field:
geoip_country_name - CRITICAL SETTINGS (Map Layers):
- Click Map Layers (or Layer 1) to expand it.
- Location mode: Lookup.
- Lookup field:
geoip_country_name. - Gazetteer: Countries. (Do not use ISO 3166 unless your logs use 2-letter codes like 'CA' or 'US').
All of this ends up looking something like:

🚨 Part 5: Active Response (Discord & Email Alerting)
🏗️ Step 1: Set Up Your Contact Points
In Grafana > Alerting > Contact Points, create a Discord webhook and/or SMTP (Email) using a Gmail App Password.
🛠️ Step 2: Create the Alert Rule
Edit one of the panels you created->Click Alert button (Bell icon)->Configure alert parameters as follows:
We want an alert that triggers if an IP address is blocked more than 15 times in 1 minute. This usually indicates a targeted brute-force attack or a misconfigured bot. Can do this in the gui itself or here via the code snippet.
- The LogQL Alert Query:
sum by (src_ip) (
  count_over_time(
    {host="OPNsense"} |= "block"
    | regexp `(?P<src_ip>\d{1,3}(?:\.\d{1,3}){3})`
    [1m]
  )
)
- Set Threshold: Set the condition to
IS ABOVE 15. - Evaluate: Set it to evaluate every
1mfor2m(this prevents "flapping" or false positives from a single burst). - Configure Notifications: Select the contact points you created earlier (Discord/Email).
🎨 Step 3: Formatting the "Wall of Text"
By default, Grafana alerts look like a mess of JSON. We can use a Message Template to make them readable.
Go to Alerting > Notification Templates and add a template named discord_security:
Add a template named discord_security:
{{ define "discord_security" }}
  {{ range .Alerts.Firing }}
    **🚨 Security Alert: Brute Force Detected**
    **Source IP:** {{ .Labels.src_ip }}
    **Status:** {{ .Status }}
    **View Dashboard:** [Click Here](https://grafana.yourdomain.com)
  {{ end }}
{{ end }}
✉️Step 4: Email (The "Official" Record)
To send emails, Grafana needs an SMTP server. If you use Gmail, you'll need an App Password. Update your grafana.ini (or environment variables in Docker):
GF_SMTP_ENABLED: "true"
GF_SMTP_HOST: "smtp.gmail.com:587"
GF_SMTP_USER: "[email protected]"
GF_SMTP_PASSWORD: "your-app-password"
GF_SMTP_FROM_ADDRESS: "[email protected]"
Critical Best Practice: "Alert Fatigue"
The quickest way to ignore security is to get 500 notifications a day.
- Silence the LAN: Always exclude your internal IP ranges (
192.168.x.x) from your alert queries so you don't alert yourself while testing. - Grouping: Set your Notification Policy to "Group by
src_ip." This ensures that if one guy attacks you 1,000 times, you get one message saying he's attacking, not 1,000 separate pings.
📑 FAQ: Alerting & Notifications
Q: Can I alert on specific countries? A: Absolutely. If you followed the GeoIP part of the guide, you can change your query to {geoip_country_name="Russia"} or {geoip_country_name="China"} to get an instant ping whenever someone from those regions hits your proxy.
Q: What is the cost of sending these alerts? A: Discord Webhooks and Gmail SMTP are free. The only "cost" is the CPU cycle Grafana uses to run the query every minute.
Q: Can I send these to Telegram or Pushover too? A: Yes, Grafana supports almost every major notification platform natively. The setup is nearly identical to the Discord Webhook.
For more about Grafana alerting, check out their great documentation: https://grafana.com/docs/grafana/latest/alerting/ and https://grafana.com/docs/grafana/latest/alerting/guides/best-practices/
🔍 Troubleshooting & Common Pitfalls
1. The Map is blank!
- Check the Gazetteer: If your logs say "Canada", ensure the Map Layer Gazetteer is set to Countries, not ISO 3166.
- Check your Browser: Hardened browsers (LibreWolf, Brave) often block WebGL, which Grafana needs. Try Firefox or Chrome.
- Check Ad Blockers: Your Pi-hole might be blocking
cartocdn.comoropenstreetmap.org.
2. My Graphs say "Limit Reached"
- You are trying to graph 2,000 IPs at once. Switch the query to Instant (for tables) or wrap it in
topk(10, ...)(for graphs).
3. "No Data" on OPNsense Panels
- Did you set OPNsense to RFC 5424? If you left it on default syslog, the Regex won't match anything.
4. My Bar Gauge is just one big "Total" bar
- Go to Value Options in the sidebar and change "Show" to "All Values".
- Time Sync is Critical
- If your Docker host and OPNsense clock are more than a few seconds apart, Loki will reject the logs as "out of order." Use NTP on all devices.
📑 FAQ
Q: Why use Loki instead of ELK (Elasticsearch)? A: Loki is "Prometheus, but for logs." It is significantly lighter on RAM and CPU, making it perfect for homelabs where you don't want your monitoring tool to consume more resources than your actual apps.
Q: Can I monitor other Docker containers? A: Yes. By mounting /var/run/docker.sock to Promtail, you can automatically scrape logs from every container on your host.
Q: Is GeoIP lookup free? A: Yes, MaxMind offers a "GeoLite2" version which is free for personal use and updated weekly.
Conclusion🔥
You now have a robust Mini-SIEM. It auto-deletes old logs, handles traffic spikes, and intelligently maps threats. You can now see exactly who is knocking on your network's door, from which country, and whether your firewall or Fail2Ban slammed the door in their face.


Member discussion